A trace (also called ‘A-scan’, ‘1D measurement’, ‘GPR point reading’) consists of a sequence of samples collected from a single GPR data channel showing the time variation of signal amplitude.
In practice, and visually on the screen as GPR data is collected, a trace is a vertical column of sampling points with sample collection time increasing downward. As we start our measurements, a pulse is generated by the transmitter (Tx) inside our GPR instrument. The pulse will travel into the subsurface and part of the energy of this pulse will eventually travel back to the antenna and is registered by the receiver (Rx) part of the instrument. As the transmitter emits the pulse/signal, the receiver will sample the returning signal amplitude at very precise time intervals until the trace is completed.
The trace represents one single measurement point along your GPR profile. The strength or amplitude of the reflection recorded, for the radar pulse, is shown as negative or positive oscillations on the trace. These oscillations are turned in to a grey scale and when you collect GPR data these small strips of traces build up the resulting radargram.
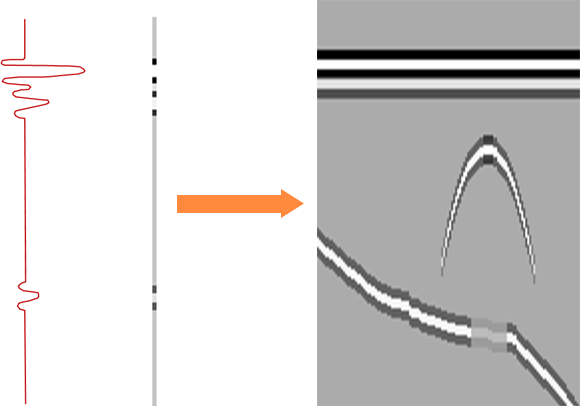
The single trace turned into a grey scale depending on the amplitude (strength) of the reflections. When place side by side, we create a radargram.
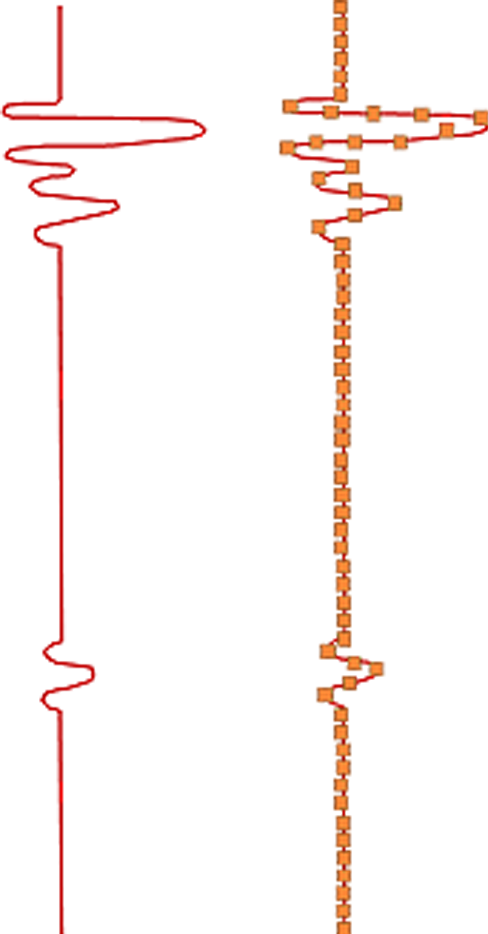
Each trace is actually composed of individual building blocks, so called samples, the smallest measured instant digital value of the recorded radar signal at one specific time. In a modern GPR instrument consists of several hundreds of samples and each sample is stacked several times to get the clearest possible signal.
The trace is also called an A-scan whereas B-scan represents the radargram.
More to read
Application areas
Methods
Case Stories
Products