The views and opinions expressed, are those of the author(s) and do not necessarily reflect the official policy or position of Guideline Geo AB
As the population of planet Earth grows, so do cities and infrastructure and with that, the invisible subsurface is getting more and more crowded. The first underground system for water and sewage dates back to around 4000 BC, and since then we have constructed innumerous pipes, cables, tunnels, and other constructions below the ground surface.
These are sometimes properly documented with a precise location in both X, Y and Z, but most often the location is unknown or quite diffuse. Over the past century the infrastructure beneath us has changed not only in the broadening nature of materials and construction methods but also in the density of these networks. This increasing complexity translates to an increasing risk for utility strikes, but more important, to an increased risk to people’s safety.
So, what do we do, when we need to extend, renew, and maintain all this subsurface infrastructure? We can use AI. But first something else.

Development of utilities, from 4000 BC till today.
Standards, Archive drilling and Locators
We are both happy to live in countries where we have; 1) Standards to lean on, such as PAS-128 in the UK, that govern the methodologies, quality levels, accuracy etc. used to deliver utility surveys in a proper way or 2) Easily accessible interactive webpages, such as in Sweden, with information on a majority of major utilities. But elsewhere, the situation can be completely different, where maps are scarce, non-existing or wrong. And also we, in the UK and Sweden, are still in need of utility location. As you never know…
Typically utility location can be split into two important aspects; ‘archive drilling’ and site work. The office side should not be underestimated! Search for historical records, interviews with constructions workers can take you far.
The second aspect, the site work, starts with lifting inspection covers in the work area. So let´s do it! When lifting a cover we can visually identify the size, depth, and type of utility and once this is done, we can proceed to trace that utility throughout the site.

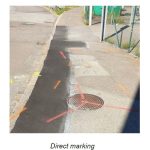
Photo showing a manhole cover with the internal chamber extents, pipe depths, diameters and positions all sprayed onto the ground surface.
If the utility is metallic, induce an electromagnetic signal into the utility itself and if the utility is a hollow, open clay or plastic pipe then a signal can be induced by threading a tracer cable. Once a signal has been induced, it is possible to locate the utility from the surface using a receiver, an electromagnetic locator (EML), that is tuned to the frequency of the signal being induced. And when the service line is not accessible from a cover, a passive EML can be used instead.
EML covers many bases, in a very efficient way, but still leaves gaps in your map. For example plastic gas, water mains, clay pipes and even some types of metallic pipes are undetectable to EML alone. Nor can EML detect changes in the ground or geology. So to add more detail to our picture we also need use of another technology, ideally ground penetrating radar, GPR.
GPR for Utilities
GPR is a perfect tool to provide more details to your investigation of the crowded subsurface. This can be done from ‘quick-and-dirty’ direct marks on the street to more advanced post-processed images. Let´s look at some examples!
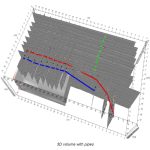
But how to interpret this data in an efficient way? Yes, now we have finally reached the AI, Artificial Intelligence.
Aid by AI
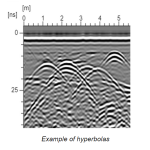
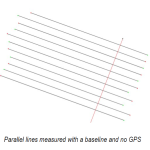
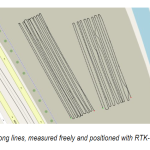
| As you saw in the example above, utilities form hyperbolas in GPR data. And the location of the object creating the hyperbola is exactly on the apex, and nowhere else. These are most often quite clear and easy to identify. But sometimes conditions cause a lack of clarity, data are hard to interpret and you may have collected mile after mile of profiles. Wouldn´t it be nice to have an assistant picking all these hyperbolas in an effortless way? Or make you more aware of when you pass something interesting?
|

Today you can use MALÅ AI to do it for you! Sweet! And for the first time, from October 2021, directly in the field, in real-time if you want. Your only work will be to confirm which of the AI markers are really a utility or some other interesting subsurface feature and not a single object as a stone. Then you also have an aid to create pipes/cables from these identified points and export them directly to your CAD software as a fully georeferenced output, in 3D, providing separate layers among all your other layers of information from the investigation site. So, work done!
To conclude
With a continuously growing utility network, the tools to locate, and visualize the same, needs to be efficient. With MALÅ AI, we now have a way to provide invaluable interpretation support for inexperienced users but also speed up the interpretation process for more experienced users, thus saving valuable time. As a general rule we used to say that 0.5 days of data processing/picking was needed for every 1 day of data collection when using single channel GPR. Today, with MALÅ AI, this will be much faster. And more precise.
With the development of new antennas and AI technologies, the landscape for the utility industry is shifting visibly in favor of more efficient and confident datasets. And by that, helping us to understand our crowded subsurface.


Jaana Gustafsson, Applications Specialist, Phd


Harry Higgs, Application Engineer, BSc FGS
P.S. Stay tuned for Our crowded subsurface – Part II, exploring historical remains. D.S
The views and opinions expressed, are those of the author(s) and do not necessarily reflect the official policy or position of Guideline Geo AB