What Are Electrical Resistivity and Induced Polarization?
Electrical resistivity methods work by sending an electrical current into the ground and mapping the resistance to that current flow. Engineers and geophysicists then convert that resistance to resistivity – a material property that predicts the composition, structure, and strength of subsurface materials. Different geological materials exhibit distinct resistivity values: the presence of water or mineral ores typically lowers a material’s resistivity, while pollutants also alter recorded values. Stronger, harder deposits generally show higher resistivity than structurally weakened rock.
Induced polarization (IP) methods measure the chargeability of the ground, which – like electrical resistivity – varies with current ground conditions.
Application Areas for Electrical Resistivity Methods
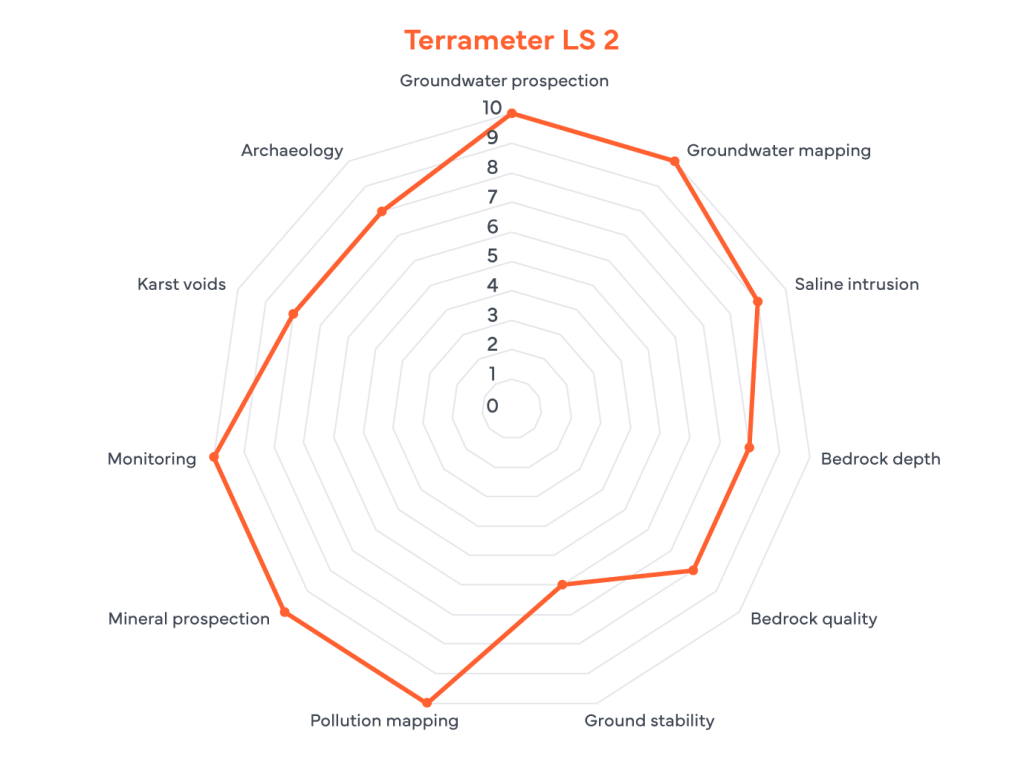
ERT and IP methods set the industry standard for groundwater prospection (10/10) and pollution mapping (10/10). For projects involving aquifer location, contaminant plume tracking, or long-term environmental monitoring (10/10), electrical imaging is the primary methodology.
A system like the [ABEM Terrameter LS2] delivers exceptional versatility, performing very well in archaeology (8/10) and mineral prospection (10/10). It excels at identifying saline intrusion (9/10), where the high contrast between fresh and saltwater produces a clear electrical signature that other methods often miss.
ERT also capably identifies karst voids (8/10) and determines bedrock depth (8/10), though practitioners often combine it with seismic data in these applications. Where seismic excels at mapping the physical “hardness” of a boundary, ERT adds value by revealing moisture content and clay content within those structures.
ERT’s main limitation involves ground stability assessments (6/10). Because electrical methods measure resistivity rather than mechanical stiffness, they cannot directly determine load-bearing capacity. For ground stability investigations, ERT works best as a complementary tool – identifying wet zones or soft soils that may contribute to future failures.
Why do I need an electrical resistivity system?
An electrical resistivity system provides an efficient, non-destructive way to map subsurface conditions – such as bedrock depth or groundwater levels – with far greater data coverage than traditional, point-by-point intrusive methods like drilling or digging. The broad range of models and accessories in the ABEM Terrameter LS 2 product range makes it adaptable to a wide variety of applications and budgets. The instrument also measures the IP (induced polarization) effect and SP (self-potential), extending its value across multiple survey types.
Field teams can conduct straightforward soundings (measuring resistivity against depth), 2D profiles – known as ERT, Electrical Resistivity Tomography – or full 3D volumetric surveys. The Terrameter LS 2 collects data on land, in water, or within boreholes, and supports both single “point in time” snapshots and repeated readings for long-term subsurface monitoring.
The most common applications include groundwater aquifer investigations, waste and landfill mapping, and groundwater contaminant detection (including saltwater intrusion). Geological investigations for mapping soil composition, bedrock stratigraphy, and subsurface structural changes represent another key application area. Field professionals also widely apply electrical resistivity surveys to determine depth to bedrock, map bedrock topography, and identify fractures and fault zones.
Mapping Changing Resistivity in the Subsurface
Because resistivity is a “galvanic” method, it requires a physical electrical connection to the ground. Surveyors typically push steel electrodes directly into the material under investigation, although plate electrodes work on some harder surfaces. Two current electrodes inject electrical current into the ground, while at least two potential electrodes record the resulting voltage. From the known injected current and measured voltage, the instrument calculates the ground’s electrical resistance.
Processing Resistivity Data: The Inversion Method
The instrument then converts the resistance value into apparent resistivity – a measurement reflecting current flowing through the entire ground volume beneath the electrodes, rather than data from a single discrete point or layer. These apparent resistivity values alone do not support a direct geological interpretation; the data requires an additional processing step called inversion. Inversion software builds a resistivity distribution model that would produce results matching the field data. The resistivity values within that model then form the basis for geological interpretation.
Differentiating Subsurface Materials
In hydrogeophysical investigations such as groundwater mapping, ERT surveys can differentiate clay (low resistivity) from sand (high resistivity), saltwater (low resistivity) from freshwater (high resistivity), and wet sand (lower resistivity) from dry sand (high resistivity).
However, resistivity-to-material translation is non-unique: the resistivity ranges of different geological materials overlap, and interpreters must manage a degree of ambiguity. Completely different geological layers in entirely different settings can share identical resistivity values. Prior knowledge of the geological setting – drawn from local expertise, geological maps, and/or borehole data – must therefore always inform the interpretation of any geophysical survey.
Reducing Ambiguity with Induced Polarization (IP)
Adding IP (induced polarization) surveys makes it easier to differentiate between some of these materials by exploiting differences in chargeability – reducing the interpretive ambiguity that resistivity data alone cannot resolve.


Points, 1D, 2D or 3D data?
Depending on electrode positioning, the instrument collects individual data points at different depths (Z coordinate) and across different surface positions (X and Y coordinates). These individual points then combine to form a 1D sounding, 2D profile, or 3D volume.
1D sounding (VES) & profiling
A Vertical Electrical Sounding (VES) collects data from multiple depths beneath a single fixed surface point. All data points share the same surface position (X and Y coordinates), while the instrument records each at a progressively greater depth (Z coordinate). The setup centres electrode placement around a fixed midpoint: the further from that midpoint the operator places the electrodes, the deeper the measurement penetrates. For each data point, the operator repositions the electrodes manually.
Geophysicists typically plot VES data on a graph with depth on one axis and apparent resistivity on the other, then submit the raw data for inversion processing.

Image: ABEM Terrameter LS 2 VES layout, with two potential electrodes and two current electrodes, moved further out for each measurement depth.
Resistivity Profiling
Geophysicists can also conduct resistivity investigations at a constant depth across different surface positions – a technique known as profiling. Unlike VES, profiling data typically bypass inversion; the final output is a plot of resistance or apparent resistivity against profile distance.

2D and 3D measurements (ERT)
Combining measurements at different depths and lateral positions forms an ERT (Electrical Resistivity Tomography) survey – also known as Electrical Resistivity Imaging. Because ERT is a multi-dimensional method, the instrument captures data points across a 2D profile or within a 3D grid.
For a 2D profile, the operator places multiple electrodes in a line at a set spacing. The system automatically selects which electrodes to use for current injection and voltage readings, capturing a high number of data points in a short time. Each data point carries varying X and Z coordinates but shares a fixed Y coordinate.
For large-scale 3D surveys, processing software combines data from multiple parallel 2D survey lines to model resistivity variations in X, Y, and Z simultaneously – geophysicists specifically call this approach a 2.5D survey. For smaller survey areas, operators lay electrodes out in a grid and the instrument builds the 3D dataset directly, producing a true 3D survey.

ABEM Terrameter LS 2 ERT layout. Depending on the distance between the potential and current electrode, different volumes of the 2D profile is measured.
Recording changes in ground conditions over time (monitoring)
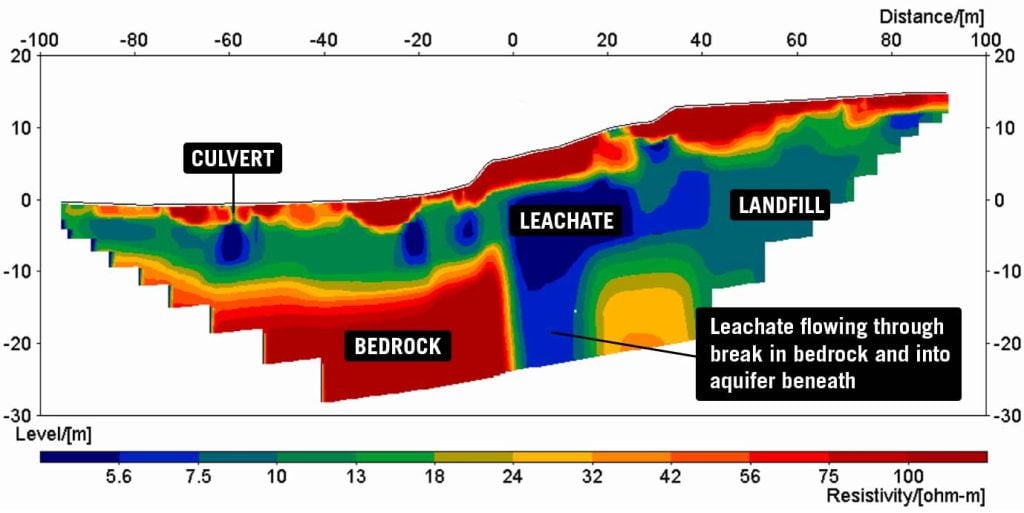
Resistivity is an excellent technique to use as a monitoring tool to record changes in ground conditions. Typical applications include groundwater monitoring around landfill areas, to see spreading of leachate or monitoring of water seepage through earth dams. Measurements can be made by returning to the same place several times to repeat measurements, or equipment can be left in situ as part of an automated monitoring project.
Electrical Resistivity Method Variations: IP and SP
The two primary variations of the electrical resistivity method are IP (induced polarization) and SP (self-potential).
Induced Polarization (IP): Measuring Chargeability
IP is an active method – one that requires current injection – where the instrument records how ground voltage reacts as it switches current on and off. Geophysicists call this reaction the chargeability of a material. The instrument collects chargeability data within the same measurement cycle as resistivity data, and this additional dataset strengthens material interpretation. Mineral ores and clay deposits, for example, exhibit high chargeability values.
Beyond Land Surveys: Water and Borehole Applications
Resistivity and IP surveys extend well beyond surface land measurements. Field teams can deploy these methods within bodies of water to investigate sediments and underlying geology, and within boreholes to achieve improved resolution at depth.
Self-Potential (SP): Recording Natural Ground Voltages
The same hardware also captures additional datasets. SP (Spontaneous or Self-Potential) records the natural voltages already present in the ground without injecting any current. Practitioners most commonly apply SP to identify large sulfide ore bodies, though it also serves in detecting water seepage and mapping pollution plumes.
Other Considerations with electrical resistivity methods
Resistivity measurements work for a huge range of different ground conditions, but the method has some limitations:
- Over bare rock or very hard/dry/frozen surfaces it may not be possible to hammer in electrodes and they would need to be drilled in which is a laborious process. Custom-made plate electrodes can sometimes be an option.
- If the investigation depth is more than 500 meters another geophysical investigation technique should be considered.
- The length of the cables used can be extensive; the ratio of depth to cable length is approximately 1-to-5 so, for a maximum depth of 100m, the system will require a 500m cable spread.
- High resolution results need a very dense electrode set-up, which increases the field time. A rule of thumb is that the theoretical lateral resolution of an ERT survey is approximately half the electrode spacing.

Related Products
Related Case Stories
- Resistivity Investigations for a Water Storage Dam Project in Pakistan
- Mapping of Hydrocarbon Contaminants with Electrical Resistivity Tomography (ERT)
- Manganese Ore Exploration Using Electrical Resistivity and Induced Polarization Methods
- Subsurface Evaluation of Copper Ore Deposits
- Resistivity Investigations for Geological Mapping in the Scottish Highlands
- Joining Geotechnical Investigations with Geophysical Results
- Resistivity Investigations to map Groundwater Sources
- Resistivity and GPR Combination Results in Better Understanding
- Threats to the Ground Water Table