The difference between 1D, 2D and 3D geophysical measurements is related to how you measure and process the data you collect. For 1D measurements data are only collected beneath a single point at the surface, for 2D a profile is measured and, for 3D, data from across a volume of ground is collected.
1D measurements
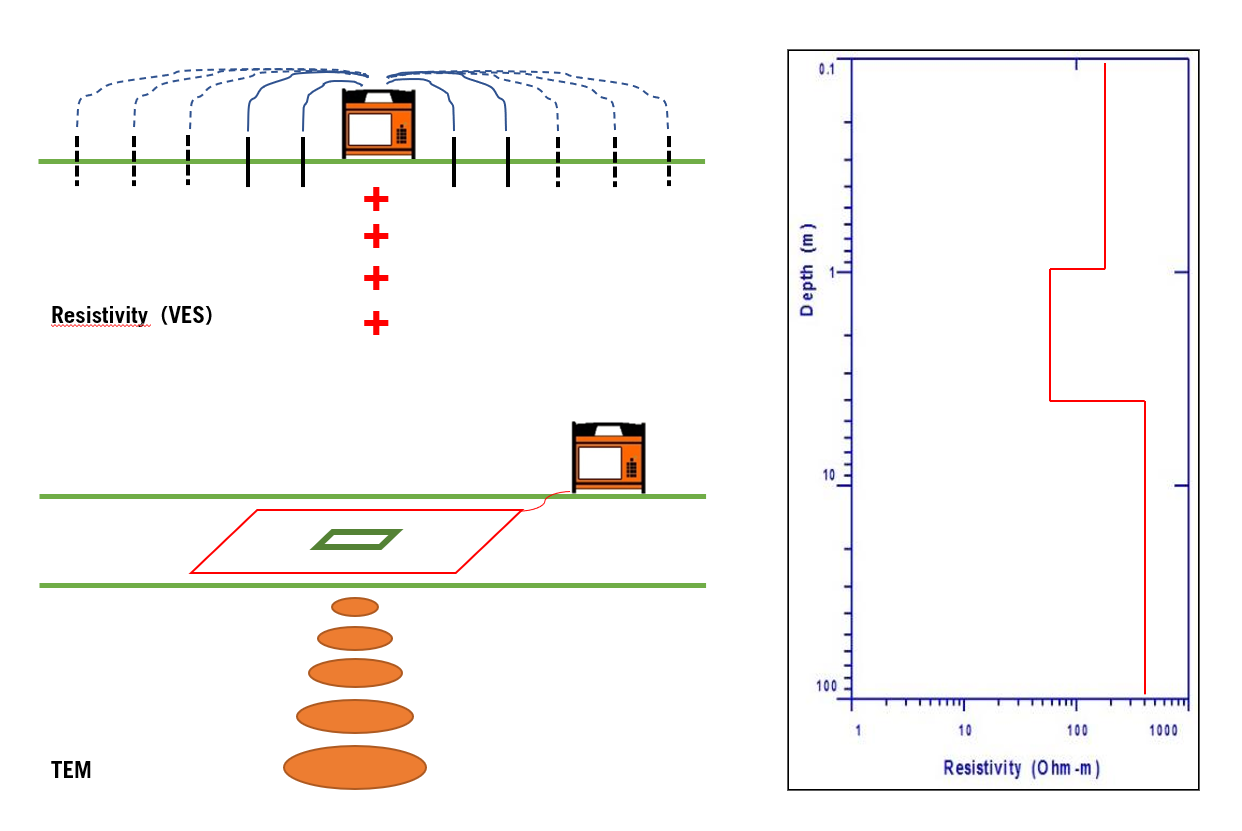
1D measurements investigate the geophysical properties beneath a single point. Common 1D methods are Resistivity VES (Vertical Electrical Sounding), TEM (Transient Electromagnetics) and vertical seismic profiling (VSP). Such investigations will give you physical parameters (e.g. resistivity or seismic velocity) at increasing depth from the ground surface, allowing us to make a layered interpretation of the geology/groundwater/structure at a single location.
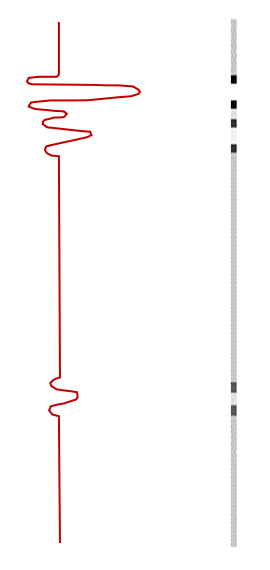
An individual GPR trace or scan, is also a 1D measurement, but not that useful compared to 2D or 3D GPR investigations.
The amplitudes of the reflections recorded in the trace are turned into a grey scale, and these single lines will be used to build up a 2D radargram.
2D measurements
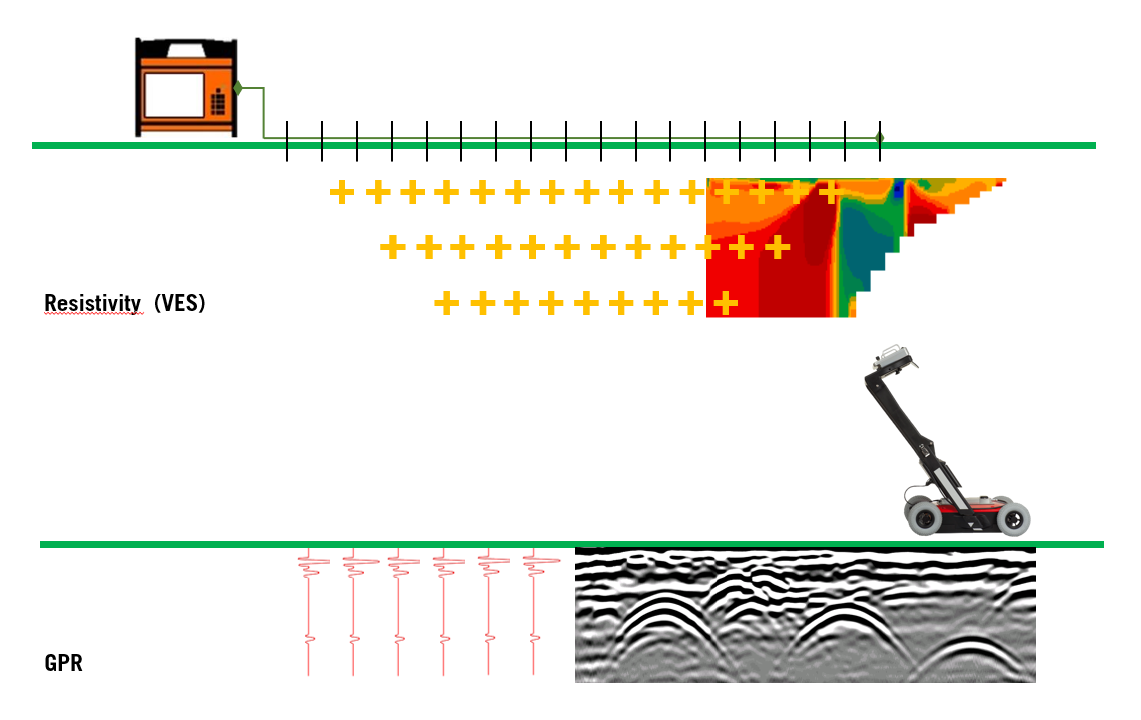
When carrying out 2D surveys, several measurement points are recorded along a profile, at the same time. Seismics, GPR and ERT (Electrical Resistivity Tomography) are all 2D-capable techniques. The results are like a vertical cut in a cake, revealing structures along a profile at different depths.
Note! 1D measurements such as VES and TEM can also be compiled into a 2D result in the post-processing stage of a project, if the points are measured at a close enough spacing.
3D measurements
When working with 3D measurements, data are collected over an area rather than along a single traverse. For what we might call “true 3D” this is achieved by using a grid of interlinked ‘sensors’ (electrodes for resistivity, geophones for seismic) or by collecting several closely-spaced parallel profiles at the same time (GPR). Typically, a 3D radar survey will use a multichannel GPR array where multiple antennas are mounted at close centres in a single box. For Resistivity and Seismic, measurements are made in multiple directions across the grid of electrodes/geophones. The result will be the complete cake, from top to bottom, where you can choose to look at individual slices from different depths, cross-sections or some kind of volume plot where only values of a particular value are displayed and others mad transparent.
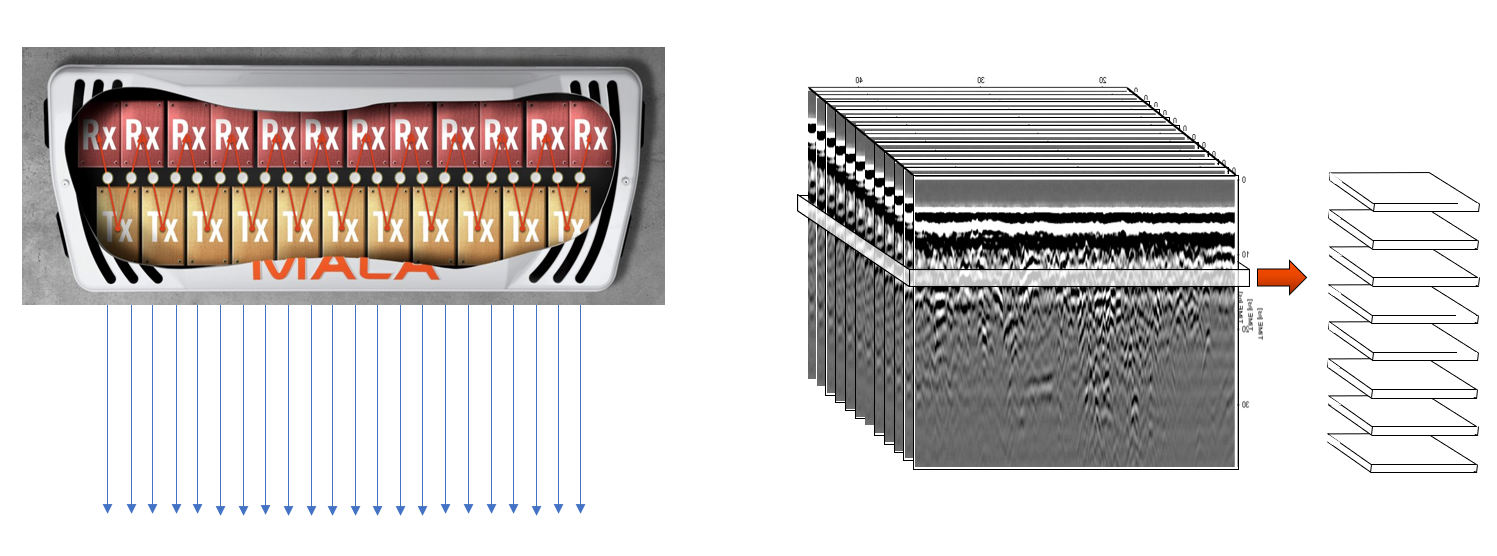
Multichannel GPR-array creates a 3D volume which can be sliced at any depth
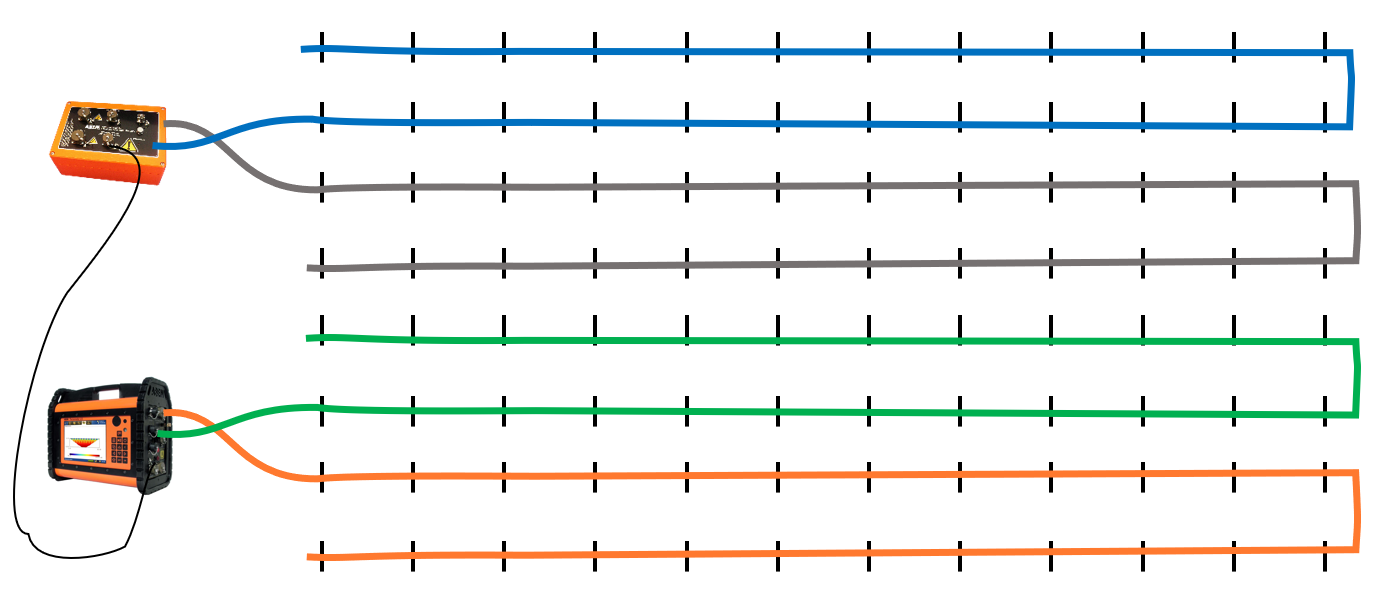
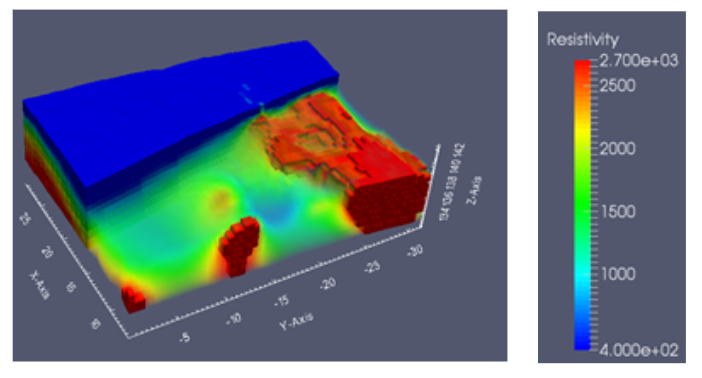
An example of a 3D ERT set up and example data
Note! A 3D result can be generated from individual 2D profiles at the post-processing stage, provided that the profiles were positioned at a close enough spacing (normally defined by some multiple of the in-line sampling interval). In Resistivity survey this is usually referred to as 2.5D survey – the final result will not be as complete or accurate as a “true 3D” measurement but will normally require far less equipment and offers more straightforward field procedure and increased flexibility. As such, this is a very common method of generating 3D models.
More to read
Application areas
Methods
Case Stories
Products