The combination of resistivity and IP measurements has proven to be an efficient way of understanding the internal structure of different types of landfill sites. This knowledge helps to predict the extent of different types of waste, contaminant spreads, gas content and soil stability.
CHALLENGE
The investigation of landfill structure can have several purposes:
– To assess soil stability
– Investigate contaminant spreading
– Mapping deposits for landfill ‘mining’
Since landfill material is usually heterogenous, changing over time due to bio-degeneration, and often has poor, inadequate, or outdated documentation, these activities can be very challenging. Individual cores and sampling are effective but only give information at discrete points. With large landfill sites, stretching from 1000 m2 to several hectares, it also becomes an expensive investigation technique, especially if dense sampling is required.
RESULTS
The examples from the different landfills clearly showed that the combination of resistivity and IP investigation was an efficient tool for mapping the structure of the buried waste as well as identifying potential groundwater contamination. The IP results made it easier to discriminate between waste and the surrounding geological material.
Through analysis of the data, the results from landfill investigations can be used for:
– Determining the extent of different types of material
– Visualizing internal structures, such as underground walls or zones with high organic content
– Estimating the final coverage thickness and status
– Providing a basis from which to assess future needs for excavation within landfills
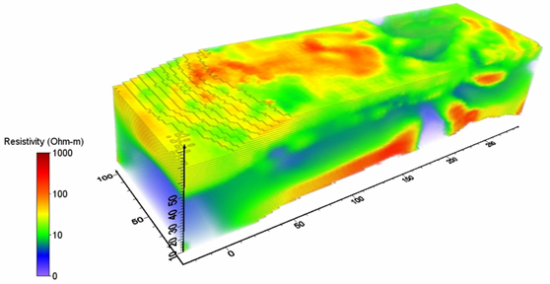
Figure 2: Resistivity model from Filborna waste deposit, with high resistivity bottom corresponding to sedimentary rock. The low resistivity zone at 200 meters corresponds to a former stream below the landfill. The resistivity of the waste varies within the landfill, showing low resistivity below the groundwater level and higher resistivity above. The low resistivity area on top corresponds to an area without cover.
More to read
More to read on the internal structure of landfills can be found here:
Measurement: 5 m electrode spacing and gradient electrode configuration. Measurements were made both as 2D and 3D projects.
Inversion & Visualization SW: Res2dinv and Res3dinv when several parallel lines were investigated.
Client
The MaLaGa-project (Mapping Landfill Gas) has been a collaborative research project between universities, public and private sector mainly between 2012 and 2015, but which is still ongoing. The main participating organizations in the project are the Department of Engineering Geology, Lund University, and Tyréns AB. The MaLaGa-project’s main aim was to develop techniques for monitoring and characterization of solid waste landfills, based on geophysical measurements.
SOLUTION
Geoelectrical methods have proven to be a particularly suitable solution, as the electrical properties are strongly related to water content, salinity, and porosity. Additionally, induced polarization has been successful for distinguishing buried waste from its surroundings. To examine the benefits of resistivity and IP measurements on landfill facilities, several sites around Helsingborg, Sweden, were investigated within the MaLaGa-project.
Resistivity and IP measurements can be performed both in 2D and 3D, where the measurements in 3D normally provide a better understanding of landfill’s naturally three-dimensional internal variation. Within the MaLaGa-project both investigation techniques were used.
Figure 1: Normalized IP model from Filborna waste deposit. The cells with high normalized chargeability are interpreted to consist of mixed waste or leakage contamination, whereas low chargeability volumes are interpreted as soil cover on top of the waste, soil barriers between waste cells and sedimentary rock below the waste.
Acknowledgement
We would like to thank MaLaGa (malagageophysics.com) and Dr. Mats Svensson, Tyréns AB and Dr. Torleif Dahlin, Engineering Geology, Lund Universty for sharing this case.